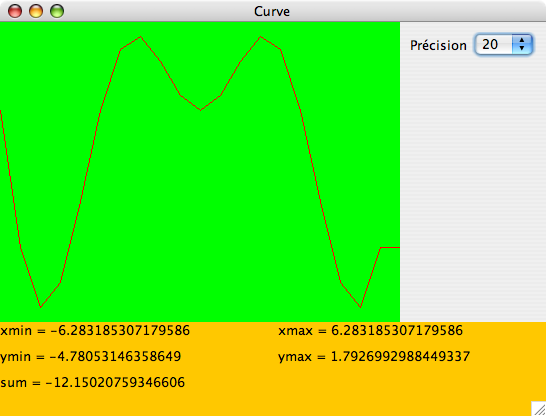
Curves
We want to build a programm which allow to visualize the variations of numerical functions, like x
-> x sin(1/x) between -Pi and Pi.
We will represent the variations of a function, say f, with argument and result of type double, on an interval x < x'. These variations will be represented by a sequence of N values (xi, f(xi)), 0 ≤ i ≤ N, where the xi
are distributed regularly between x and x'.
This representation allows both to compute an approximation of the integral of f between x and x', and to visualize this variations on a graphic pane using consecutive segments.
Part 1
You have to realize a graphic component allowing to visualize the variations of any function f between two values x and x'. The choice of the drawing precision will be done using a menu. Moreover, the following informations will be displayed :
- mouse position, if the pointer is in the panel and relatively to the representation of the function ;
- part of the plane represented in the panel ;
- approximation of the integral of f between x and x', following the number of used segments .

Part 2
You have to program a factory, given
- usual unary functions like : sin, cos, x (identity),
constant ;
- unary functions obtained by using operators on other functions given as parameter : +, -, *, /, composition
- unary function from its prefix expression, for example : "* x sin * 2 x"
and to interface it with the graphic component of the first part.
Part 3 (Project)
- implement a functionnality of "zoom" (forward and backward) ;
- allow to use different functions in the same window
- allow to use multiple windows
- define a function in a file
- ...
Rules for the project
You must use the correction of the previous part as starting point.
The project must be realize by group of two students.
The report must constain
- sources, in alphabetic order ;
- a presentation of your work (10
pages max) with at least
- how to use the software ;
- classes diagram using UML ;
- options you have considered ;
- bugs ;
- possibilities of reuse.
The code must be given as an executable archive (.jar) with the sources.
Evaluation criteria
- Quality of the sources and object architecture.
- Robustness : protection against errors during execution.
- Ergonomics of the graphical interface.
- Initiative, enterprise.
- Originality.
